

Let’s be clear up front about the issue of home affordability: there is no silver bullet, no quick fixes, and it has been decades in the making. If you care to examine home costs in countries as close as Canada and as far afield as New Zealand, you will find out that home affordability is really a major issue confronting families in many nations. We at the IFF do have policy suggestions that can point us in the right direction, including reforms we have traditionally supported: regulatory and permitting reforms, sound fiscal policies to reduce asset inflation, and, of course, reversing the immigration invasion that has artificially juiced housing demand.
How did we get here?
My father recently turned 97, necessitating greater involvement by my brother and me in his daily affairs. While reviewing his documents, we found a life insurance policy he purchased in 1945 with a $5,000 death benefit. We don’t know what possessed him to buy a life insurance policy at age 17, but since this was during World War II, perhaps he thought he would be drafted and come home in a coffin.
Does the idea of a life insurance policy with a value of $5,000, which wouldn’t buy a decent used car today, leave you scratching your head? Consider that the average home cost $3,800 in 1945, with some sources saying $4,600. Now, to further confuse you, $3,800 in 1945 is worth about $68,000 in today’s dollars if you use the government’s Consumer Price Index (CPI) calculation. So why does the real estate website Zillow peg today’s average home value at $361,000 and Redfin at $440,000?
Well, for one thing, home selling prices are not directly included in the CPI calculation. Instead, the government uses “owner’s equivalent rent” to calculate the changes in shelter cost. This change was made by the Bureau of Labor Statistics about 42 years ago, which suspiciously lowers the impact of home prices on overall inflation. We won’t enter into a debate about whether this was fair, but we would note the huge gap between the $68,000 calculated by the CPI standard and the actual value of $361,000 to $440,000. Yes, homes were much smaller on average in 1945, around 1,100 square feet. And homes now have features like automatic garage door openers and air conditioning that people didn’t have then. But a recent proposed affordable housing development in Southern Utah is targeting house sizes of 1,000 to 1,400 square feet with an average price of $375,000. So, back to 1945 sizes but not prices. And these high home prices are putting affordability out of reach for young families. Homeownership data for young adults (under 35) is trending downward. The homeownership rate in this age group has dropped to 38.6% from 45% in the ’90s.
What has changed over the last 80 years in post-WWII America, and can it be reversed? We really don’t need to go back to 1945, but rather to roughly the 1990s to understand what is going on. Yes, zoning laws in many areas are restrictive, and permitting fees have increased as local governments have demanded more funds from builders and developers to cover infrastructure. And so reversing these policy trends is a start. For example, reducing lot sizes, as sometimes required by zoning, can lower home prices because it becomes cost-effective to build smaller homes.
And tens of millions of illegal immigrants crossed our borders (not to mention legal immigration), and are competing for housing, too. From a recent report (page 29) submitted to Congress by the US Department of Housing and Urban Development:
“From March 2022 to March 2024, the foreign-born population in the United States increased by 5.1 million, the largest 2-year increase in American history. The foreign-born population has grown by 20 million since the year 2000, a 40-percent increase, and now stands at the highest level in American history, a staggering 53 million individuals. This population influx has caused significant increases in housing demand and thus, housing prices. Research finds that an increase in immigration inflows into a particular metropolitan statistical area (MSA) is associated with increases in rents in that MSA while also seeming to drive up rents and prices in neighboring MSAs. Immigration accounts for up to 100 percent of housing demand growth in some regions, and for two-thirds of rental demand growth nationwide. In California and New York, immigrants have accounted for 100 percent of all rental growth and over one-half of all growth in owner-occupied housing in recent years. In addition, immigration reduces the wages of low- and moderate-income Americans in blue collar occupations, limiting the very income growth that could have otherwise lifted them out of worst case needs status. This indicates that housing policy leaders must be part of the immigration policymaking process.”
But the rot goes deeper than that. The federal government has been massively involved in housing through its Government Sponsored Enterprises, Fannie Mae and Freddie Mac, which provide liquidity to the mortgage markets, but there are also other forms of meddling. The federal government’s Community Reinvestment Act added fuel to the fire. And Federal Reserve policy made it worse with its massive money-printing scheme over the last several decades, as it has monetized federal deficit spending.
Let’s look at how this perfect storm of government-sponsored mayhem developed and affects housing to this day. In the early 2000s, the combination of the Community Reinvestment Act, which pressured lenders to offer mortgages to “underserved” minority communities, and the Federal Reserve's artificially low federal funds rate, set off a building and buying boom.
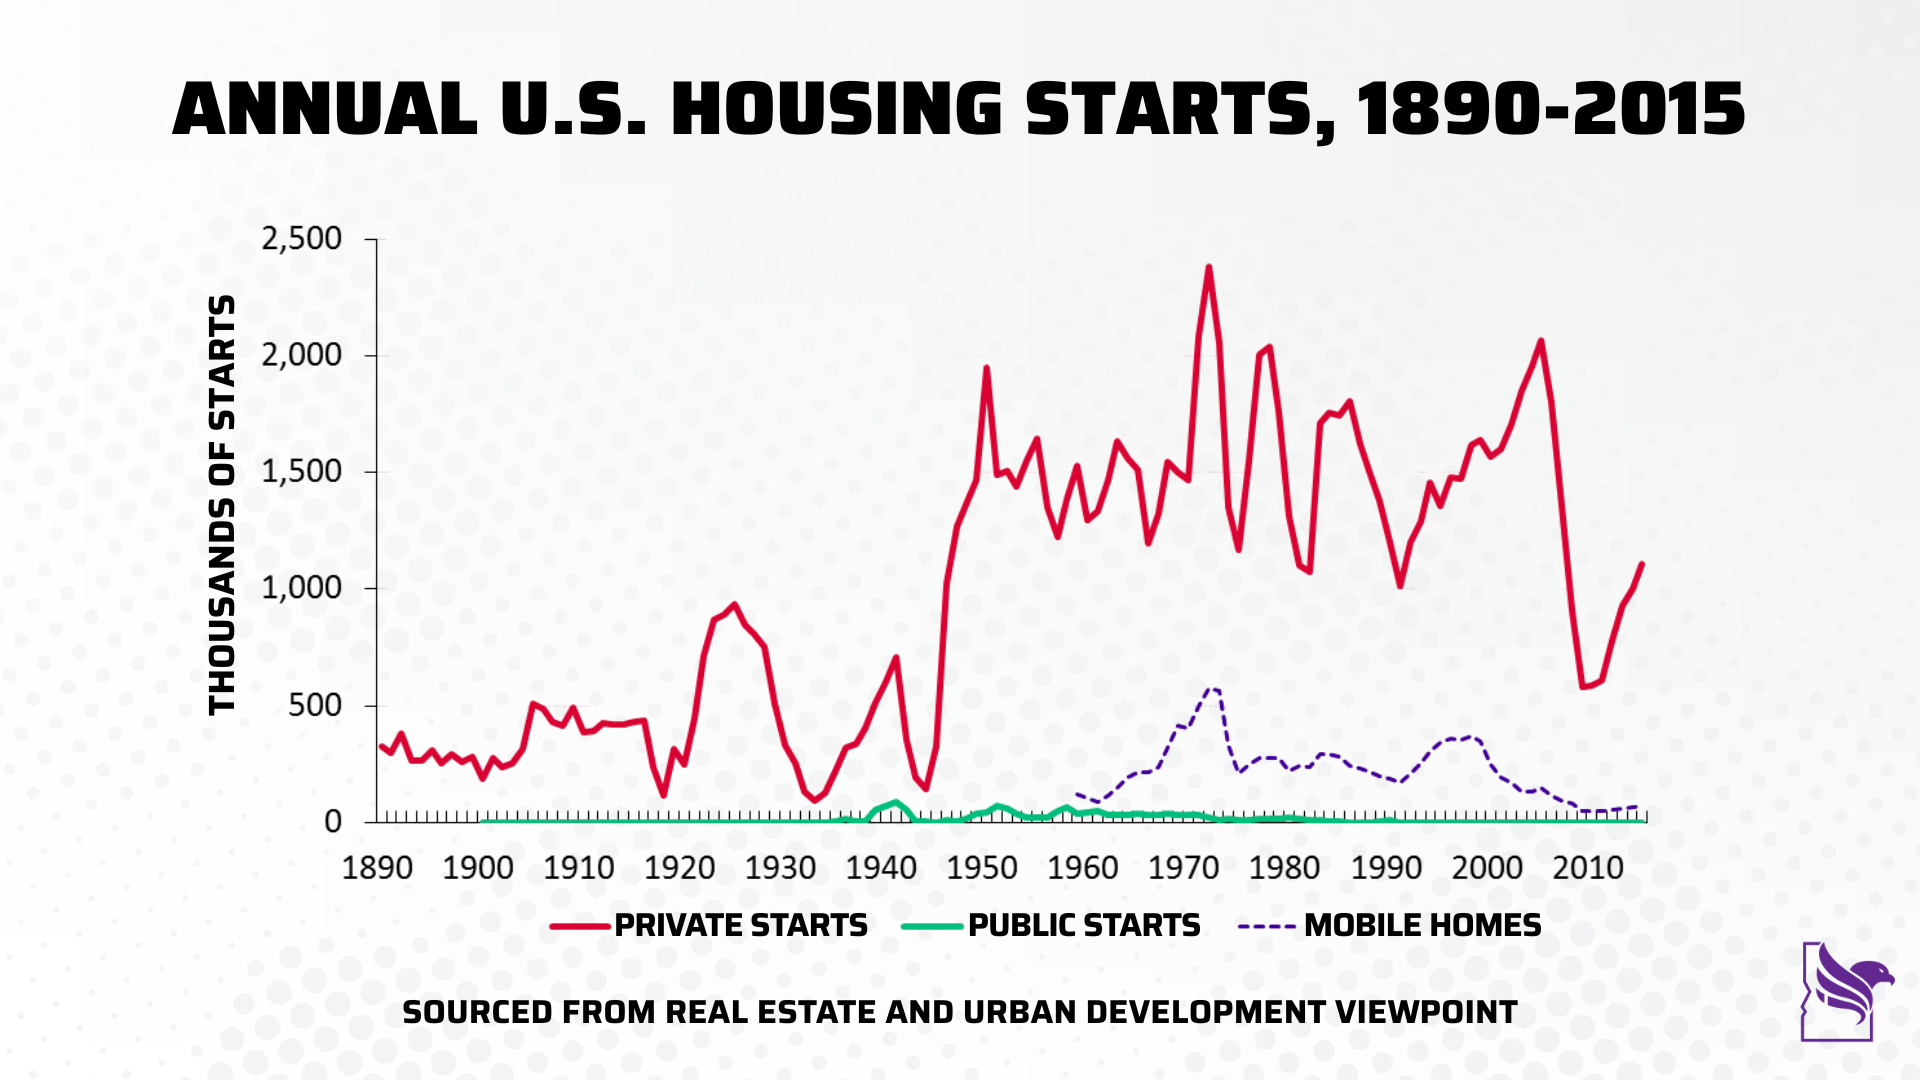
Why does all of this matter? The boom in the early 2000s set the stage for the bust in 2008. After which, new-home construction from 2010 to 2020 was depressed to such an extent that the nation’s housing stock has not caught up. And here is the proof. The housing market, as measured by new housing builds, declined so much in this period that you have to go back to the mid-1940s to get back to a level that prevailed after the 2008 bust. Government policies created a massive housing bubble, the bubble burst, and 15 years later, we are still dealing with the consequences of a demand-supply imbalance. The final element in this equation is that during COVID, the Federal Reserve increased the money supply, which has led to asset inflation, including housing prices. Here is a quote from an article on the money supply increases from the Mises Institute,
“Since 2009, in the wake of the global financial crisis, more than $12 trillion of the current money supply has been created. In other words, nearly two-thirds of the total existing money supply has been created just in the past thirteen years.”
Bad policy created the perfect housing storm: government goading lenders to lend and builders to build, aided by artificially low interest rates that were not consistent with the economy's performance, created a housing bubble that crashed, driving down construction. That was followed by massive money printing, driving up the prices of existing homes. And then surging immigration stimulated demand.
And here we sit with a mismatch between home prices and incomes.
So what is the solution? Let’s start by saying what it is not! Asking the government to fix this problem with more housing programs is not the solution. What is needed is a combination of reduced immigration, less regulation, and less government spending, which drives inflation, especially asset inflation. Let’s return to sound money and a productive economy driven by solid private-sector investment, which raises real wages and puts homes within reach again.